Racing Efficiency
The skilful interpretation of racing efficiency is in our view, one of the best routes to success with the GPS data. And to quote an industry expert;
“The key thing to bear in mind is that one of the best ways to use the data is to quantify racing efficiency in real time, to identify and lay short priced horses running with the choke out and back horses running efficiently, all at good prices.”
The Trading Platforms
Obviously the Trading Platforms (Bet Mover, Bet Angel, Bf Bot Manager and Gruss Betting Assistant) are all somewhat different in how they display the TPD data, however the following are generic descriptions of each dataset, as provided by the TPD API, (the source from where all the Trading Platforms import the data).
Race Pars
These are generated from past performances of winning horses at the course and distance with due regard given to going, ages and class to slightly adjust the race pars to more accurately reflect the optimal running speed.
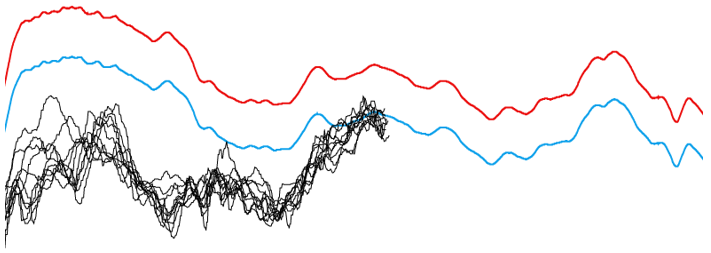
A typical set-up is shown above; The red line being the fastest 5% (of previously tracked races) and the slowest 5% being depicted with the blue line.
As the race is underway each runner has its own black line and collectively you can see if the race is running slowly or quickly and if the runners are predicted to speed up or slow down. This can be a useful addition to aid in your assessment of how the race is being run
In the example above we can see the race has run to a slow par but the pace is now picking up.
To quote the TPD CEO;
“Very few horses have the natural ability to allow them to win races regardless of how the race pace pans out.
Frankel, eventually, could win from the front the middle or the back of the field.
Elite thoroughbreds can accelerate 3 times in the race, good horses can do that twice and modest horses have a single burst of acceleration. So, watching the speeds relative to the fast or slow par lines (red and blue) can help punters predict which horses will benefit from the pace on the race. Galloping (one paced) horses win from races run near the red line. Smaller (often) horses with a good turn of foot (acceleration) will be suited by race pace that is nearer the blue par followed by a mad increase in the pace late on.
Conversely, if a sprint has taken place (above the red line) early in the race, this will negatively affect those horses who set or were closest to this (wasteful) pace.
Velocity Par Difference (VP)
The difference between the runner speed and the course par speed (at that point of the race). This highlights whether a horse is running too fast / too slow.
Velocity Fluctuation (VF)
A measure of consistency with regard to velocity. A high number may indicate that the horse is not performing well.
Velocity Error (VE)
An algorithmic calculation which results in a number highlighting how ‘off par’ the horse has run from the start of the race.
A LOW number here is preferable and zero would be perfect – however that is highly unlikely to ever happen. A low VE is around 50 and high around 100.
It is highlighted that VE (off par) is not reporting the horses positions, it is reporting how close to race par the animal has been running. The horse behind the leader could be running too slowly to par and therefore have a high number. VE is an absolute error value for speed against par speed. It will be high for horses running too slow and horses running too fast.
VE may often be very volatile towards the end of a race; for example, if a horse slows down due to already being beaten or has an unsurmountable lead. Ends of races rarely run close to par and we strongly advise not to rely on this feature towards the back end of races. The feature is to aid decision making in the early part of the race, up to the mid-point of the race.
It is noted that a horse can win with a high VE, but it will have been a very hard fought victory.
Cadence Error (CE)
Cadence corresponds to the horse’s rhythm and it is highlighted that stride length and speed are not considered in the calculation because a high cadence (high number of strides per second) could also mean a shorten stride length and consequently a low speed.
Regularity is the ideal scenario when looking at cadence. It means that the cadence needs to always remain the same, independently of the changes in strides length or speed.
The CE metric quantifies how far a horse is ‘off cadence’ and a low number is best.
Stride Frequency
A count of strides per second; average strides per second recorded in six secs increments , but excluding the first 50 meters. A High SF would indicate a sprinter and conversely a low SF would signify a middle distance runner.
Stride Frequency – Course Par
Both Bet Angel and Gruss Betting Assistant make this metric available, in slightly different guises. The number displayed being the par stride frequency of the course at the selection’s current location.
Splits / Sectional Timings
Splits or sectional timings are used to track a horse’s performance during a race. They provide a great way to compare the performance of different horses and to identify which horses are strongest in certain parts of the race.
Within each section, we could consider the time taken, average speed, distance travelled, lengths behind the leader, or in front, average stride frequency etc. Comparisons can be made between one horse and another, in the same section or the same horse in two or more other sections.
To quote the TPD CEO:
“Horses typically win by using their energy most efficiently or smoothly. By ranking each horse’s split time per furlong you can see who is running evenly.
One strategy is to lay horses that are running the fastest splits very early in the race or running fast then slow then fast. Winning horses tend to save their faster splits (relative to the field) for the end of the race.
A horse that is drawn wide that shows fastest, fastest then second fastest over the first, second and third furlongs respectively, for example, reveals that they have used up a huge amount of energy relative to the field to try and find a racing position closer to the rail.”
Split metrics are provided as a standard, customisable feature in Bet Mover. Within Bet Angel, Guardian Rules Files can be scripted to display sectional data on the one-click screen. If Gruss Betting Assistant is your chosen trading platform then the core data will need to be exported into Excel and appropriate formulae applied.
See the relevant Trading Platform User Guides for more information on set-up.